DNA barcoding and community structure assessment in a tropical forest
Project information
Project information
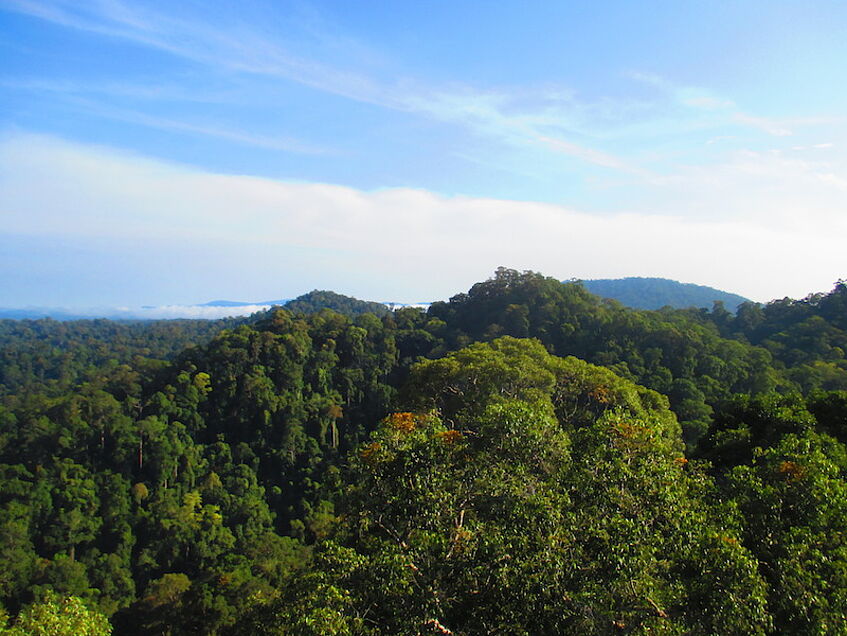
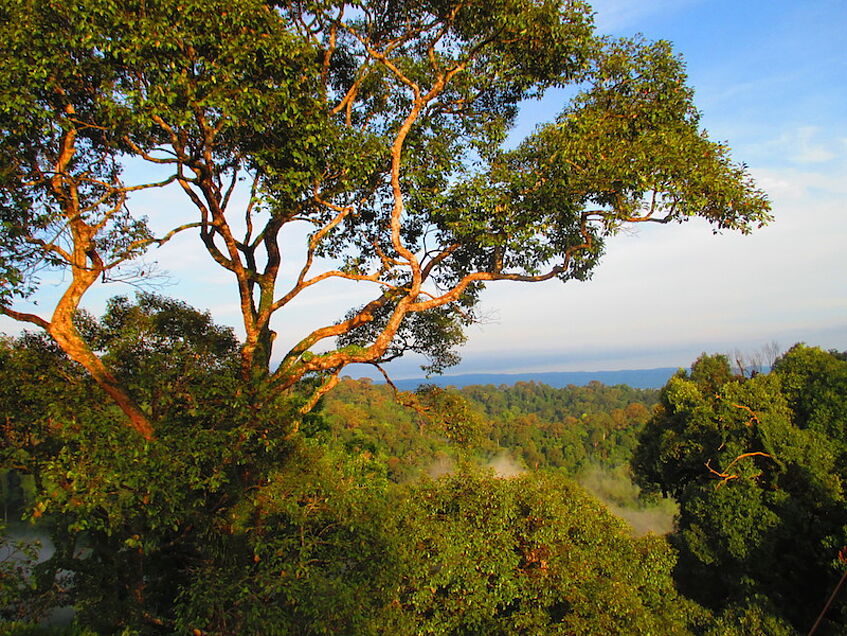
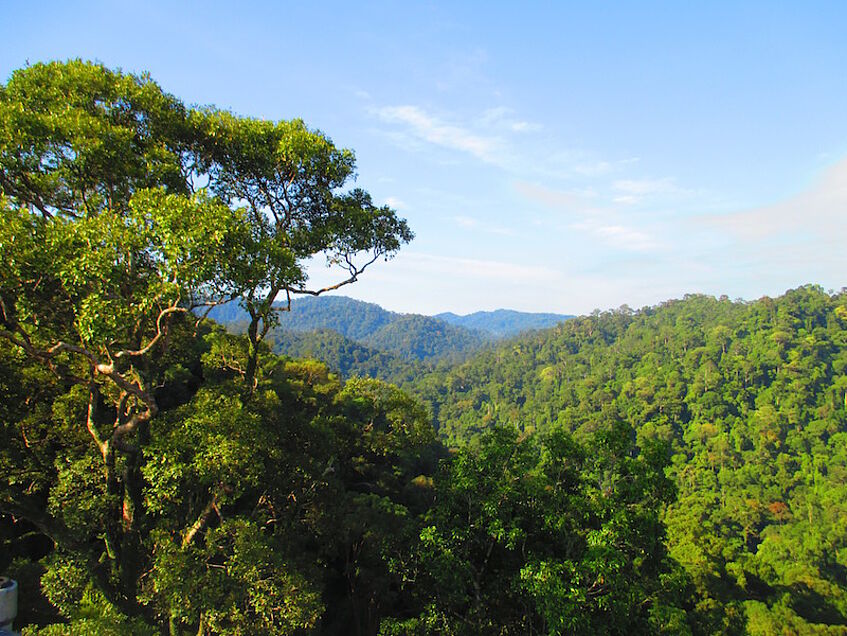
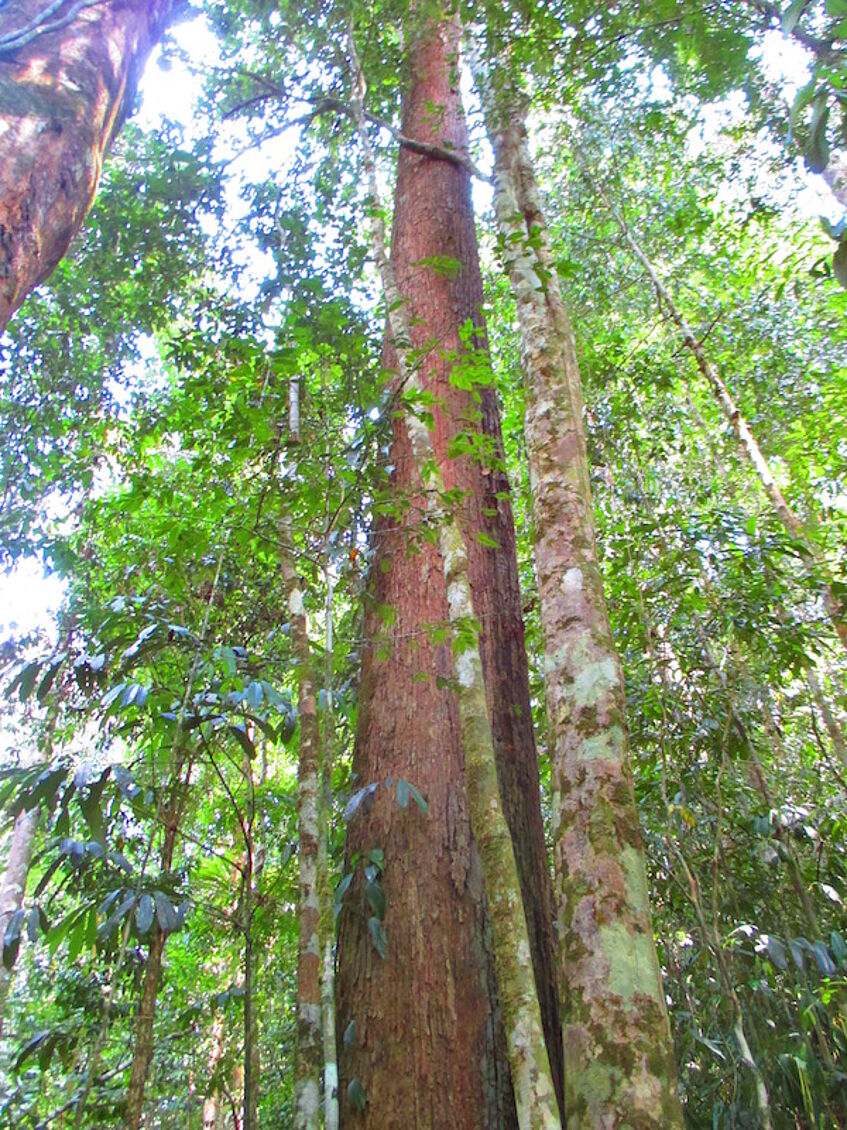
Brunei's mixed dipterocarp forests
Tropical forests are one of the world’s largest carbon sinks, yet they have been lost at high rates due to agriculture, logging, grazing, construction of dams, and other infrastructural development. Brunei Darussalam offers one of the richest ecosystems on earth; the mixed dipterocarp rainforests offer a home for 3,500 species of vascular plants. The forest type takes its name from the economically important plant family, Dipterocarpaceae, which dominates.
DNA barcoding
We aim to answer the question, “What is the phylogenetic structure within the subplots of the 25 Ha plot of Dipterocarp forest at Kuala Belalong?” The first step for this is identification of the taxa by the use of DNA barcoding. To ensure the feasibility of the project we aim to sample exhaustively 100 representative subplots, in order to barcode up to 5,000 individuals. Subplots will be taken randomly, considering the different ecological niches of this forest. This larger plot is already tagged by the UBD (Universiti Brunei Darussalam) - CTFS (Centre of Tropical Forest Science) Team with Dr Kamariah Abu Salim and Dr Stuart Davies as the Principal Investigators. For barcoding, we will sequence plastid regions rbcL and matK, as recommended by Consortium for the Barcode of Life (CBOL), including all individuals >1 cm dbh. Besides documentation and confirmation of previously described species, DNA barcoding has a high potential for identification of unknown, as well as cryptic species.
Community structure analyses
Barcode sequences will be used to reconstruct a robust phylogenetic tree using Bayesian inference and maximum parsimony (MP). Trees will be compared with expected phylogenetic patterns (APG III) to confirm the presence of phylogenetic clustering or overdispersion. Barcoded species of well represented Angiosperm families of these plots will be incoporated into the available rbcL and matK sequence matrices to get the molecular phylogeny of the family concerned.
Community structure analyses will be applied to test hypotheses that co-occuring species are randomly distributed, phylogenetic clustered (more closely related than expected by chance) or overdispersed (more distantly related than expected by chance). We will use Phylocom (Webb et al., 2008), which calculates a net relatedness index (NRI) and a nearest taxon index (NTI). Positive indices indicate phylogenetic clustering and abiotic filtering as co-occuring species tend to share similar tolerance to the abiotic environmen, whereas negative indices hint on overdispersion, suggesting that biotic factors (competition) may be structuring the tree community.
Relatedness indices will be compared to ecological parameters (moisture, light and soil nutrients, water holding capacity, pH of the soil, etc.). This will enable us to test for the possibility of correlations between ecological factors and phylogenetic community structure measures (NRI and NTI) for each subplot and the entire area, thus evaluating the influence of abiotic factors on a community.
Detailed investigation of community structure and phylogeny of Dipterocarpaceae
In particular, we will focus in this study on the predominant plant family of these forests, Dipterocarpaceae. In order to resolve the phylogeny of the Dipterocarpaceae, we will use a next generation sequencing technique: restriction site associated DNA sequencing. RAD-sequencing samples genome-wide nucleotide variation at thousands of loci simultaneously, which makes it especially useful in cases like Dipterocarpaceae where a few plastid DNA regions do not provide enough variability to resolve phylogenetic relationships. Recent studies have shown RAD-sequencing to be successful for reconstructing phylogenetic relationships in groups younger than 60 myr divergence time (Rubin et al., 2012). Dipterocarpaceae qualify as a good candidate for RAD-seq, as they are younger than 30 myr, which is the maximum age of the split Dipterocarpaceae-Sarcolaenaceae (Wikstroem et al., 2001).
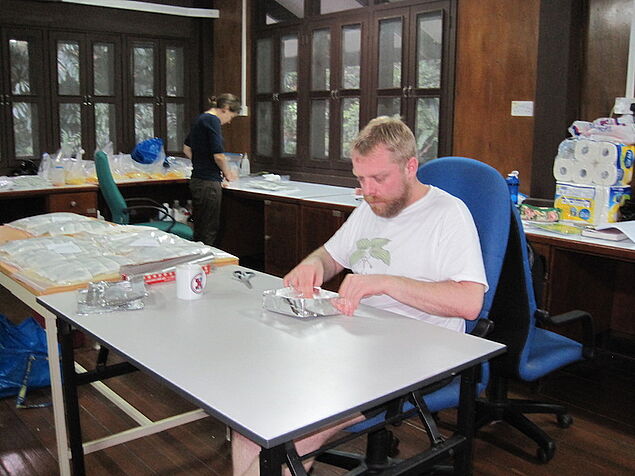
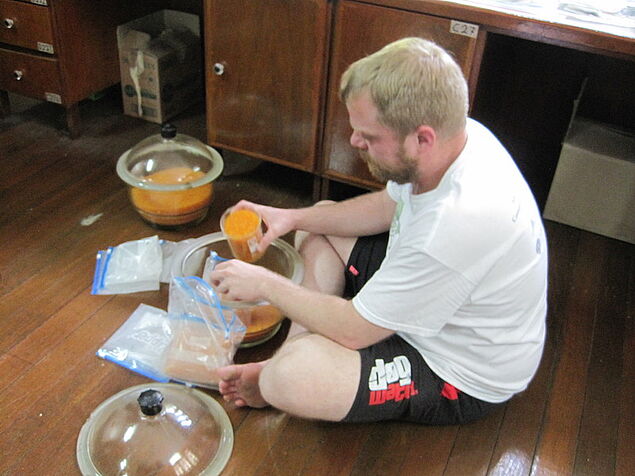
Fieldwork
Fieldwork
DNA- Barcoding and Community Structure
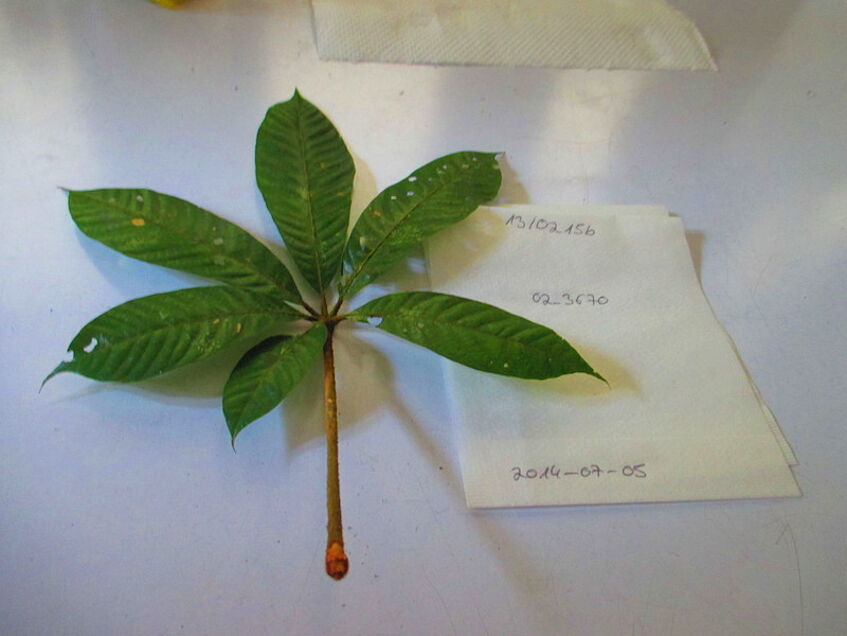
In a first field trip (June to August 2014) leaves and bark of all individual woody trees, shrubs and palms with at least 1 cm dbh (diameter at breast high) were sampled from 38 different subplots.
Subplots were 100 m² and covered different habitats like slopes, valleys and ridges.
A total number of 2038 specimens were sampled.
In the second field trip (March to June 2015) we aim to sample 3000 more specimens.
Detailed investigation of community structure and phylogeny of Dipterocarpaceae
For the detailed investigation of the dominant plant family Dipterocarpaceae we will include samples from inside the 25 ha plot, as well as from other parts of South East Asia (Sri Lanka, Malaysia, Thailand) to see if environment and geography have influenced speciation and dispersal.
Research
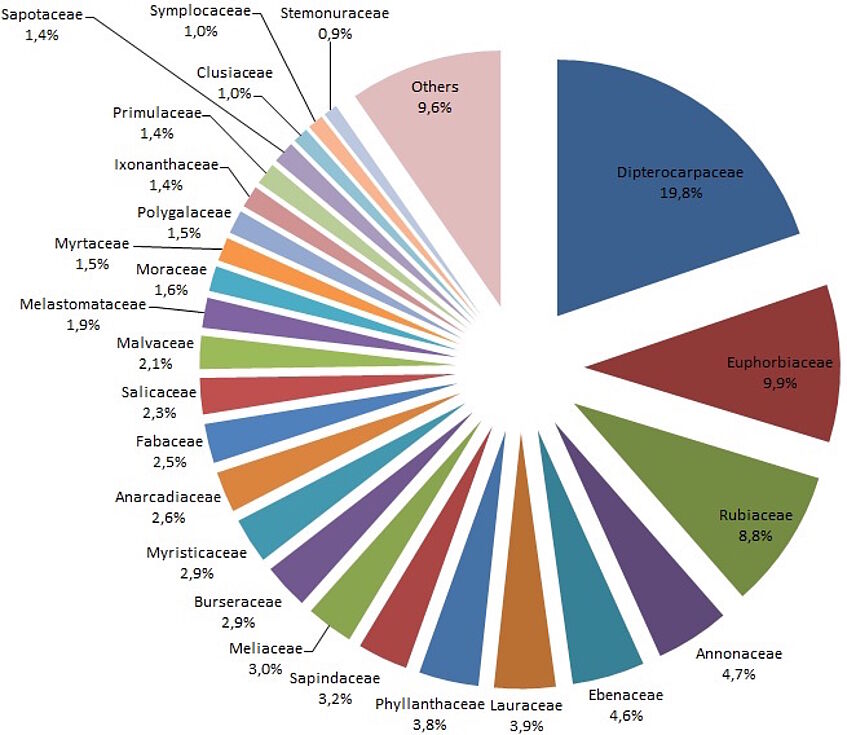
Figure 1: Abundance of plant families of the 25 ha Dipterocarp forest in Brunei Darussalam
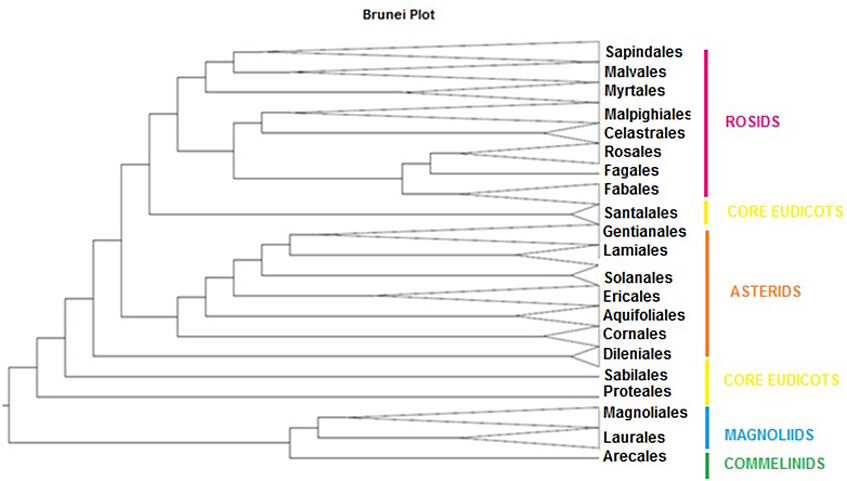
Figure 2: Cladogram showing the phylogenetic relationship of the 21 plant orders found in the 25 ha plot
Research
Ongoing research and preliminary models
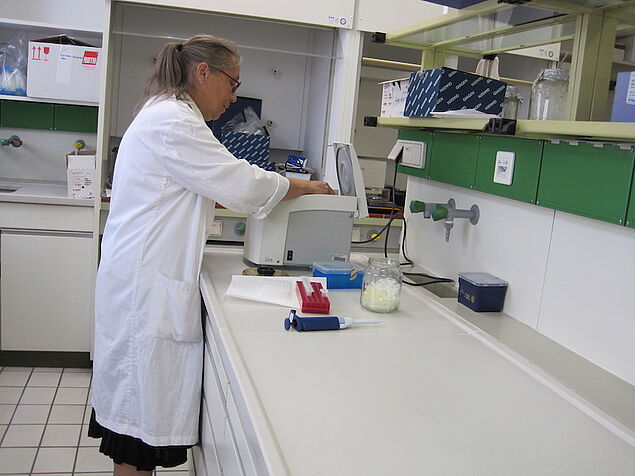
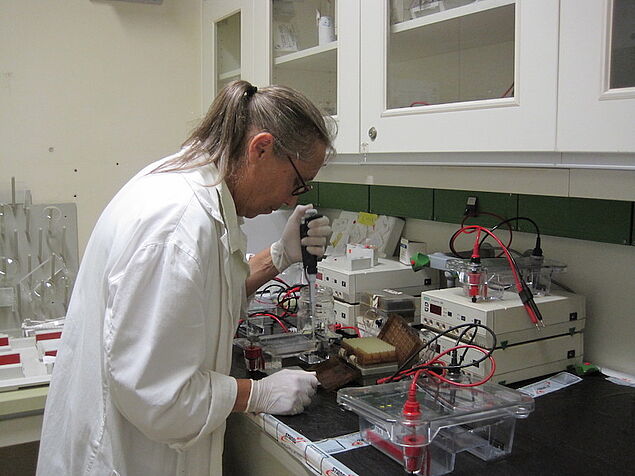
The project was started June 21st, 2014. During the first field trip, silica gel dried material was sampled from 38 subplots (more than 2000 individuals).
Laboratory work is in progress. We have extracted DNA from 1300 individuals, and PCR amplification and sequencing of the first plastid region (rbcL) has been conducted. Sequences were uploaded to the Barcode of Life data system and a blast search was carried out (algorithm: blastn). Sequences were first assigned to a family level (Figure 1).
Altogether, 56 families could be detected, whereby Dipterocarpaceae form the dominant plant family (19.8 %), followed by Euphorbiaceae (9.9 %), Rubiaceae (8.8 %), Annonaceae (4.7 %), and Ebenaceae (4.6 %).
To get first insights into the phylogenetic relationships, we conducted a Maximum Parsimony analysis and assigned all taxa to an ordinal level into a cladogram (Figure 2). Taxa which occurred in the 25 ha plot could be allocated to 21 orders.
The rbcL sequence data gives a first insights of which orders and families are distributed in the 25 ha plot. To get a robust phylogeny, we will include the matk sequence data into our analysis whose ascertainment is still in process.
People
University of Vienna
Prof. Dr. Rose Samuel
Jacqueline Heckenhauer
Dr. Michael H. J. Barfuss
Dr. Ovidiu Paun
Universiti Brunei Darussalam
Dr. Kamariah Abu Salim
Assoc. Prof. Ferry Slik
Royal Botanic Garden Edinburgh
Prof. Toby Pennington
Royal Botanic Gardens, Kew
Prof. Mark Chase